Every trade in the Seasonal Trades section has its own History page. Just click on the History link on the right hand side of any trade on the Search Results page and you will get a pop-up window that shows key historical and statistical details for each trade.
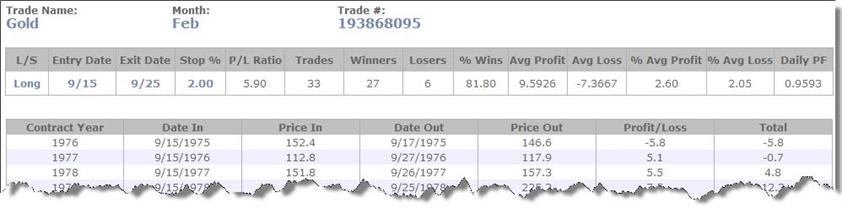
Here is a sample screen shot of the History page for a trade in February Gold with an entry date of 9/15, exit date of 9/25 and a 2% stop.
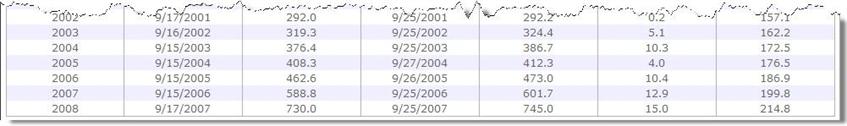
The History page shows the performance of the trade for every year of its history. It shows key performance statistics as well as annual and cumulative performance charts for the history of the trade.
For the Futures module, all Profit and Loss values are in the dollar value of the underlying contract. To calculate the actual Profit / Loss per contract you will have to multiply these Profit/Loss figures by the appropriate contract multiplier.
For the Spreads module, all Profit / Loss values are calculated in points.
Let's cover each of the fields of this page in detail (note that fields may vary slightly from module to module):
| Name | Definition |
|---|---|
| Name | The name of the futures contract, spread or stock. |
| Month | This is the contract month for the given futures contract. The trades in the screen shot above take place in the February Gold futures contract. |
| Trade # | Unique identifier of the trade within the SeasonalTrader database. |
| L/S | Whether the trade is a Long trade or a Short sell. |
|
Entry Date |
The date on which to place the trade. Trades are assumed to be entered on the close of the given date. |
| Exit Date | The date on which the trade is exited if the trade has not been stopped out prior to this date. Exits are assumed to be on the close of the given date. |
| Stop % | All trades have an associated stop loss associated. Once a trade is entered, the stop loss can be calculated by multiplying the entry price by stop loss percent and then subtracting the amount from the entry price (or adding it to the entry price for Short trades). Stops are assumed to be close only stops. If the price closes below the stop (or above on a short trade) then exit the trade. Note that stops on spreads are in points. Also note that some trades show a 100% stop loss. These trades do not use any stop loss and are best traded using an options strategy. |
| P/L Ratio | The P/L Ratio tells you the ratio of the cumulative profits to the cumulative losses over the history of the trade. A trade with a P/L Ratio of 3 has had 3 times more profits than losses. |
| Trades | Number of years this trade was made in the history of the trade. |
| Winners | Number of winning trades in the history of the trade. |
| Losers | Number of losing trades in the history of the trade. |
| % Wins | The % Wins tells you what percentage of the trades have been winners over the history of the trade. If a trade has 40 years of history and it has been profitable 30 out of 40 years then it has a P/L Ratio of 75%. |
| Avg Profit | The average profit over all the winning trades in the history of the trade. |
| Avg Loss | The average loss over all the losing trades in the history of the trade. |
| % Avg Profit | The average percentage profit (relative to entry price) for all of the winning trades in the history of the trade. |
| % Avg Loss | The average percentage loss(relative to entry price) for all of the losing trades in the history of the trade. |
| Daily PF | The daily PF is the “daily profit factor”. This figure is only relevant when comparing several trades in SIMILAR MARKETS. In other words, in markets that have the same dollar value per tick. The higher the PF, the more money the trade has made, on average, on a daily basis. PF can help you decide between several trades in the same market that tend to occur at about the same time. |
| Contract Year | For Futures trades the Contract Year field tells you which contract year to trade. For example, is in February Gold with an entry date of 9/15. When this trade was made on 9/15/2007 it was made in the Feb 2008 Gold futures contract. The trade took place in 2007 but the Contract Year was 2008. |
| Date In | The date on which the trade was executed for the given year. If the defined entry date is a non-trading day then the trade goes on the first trading date following the Entry Date. |
| Price In | The closing price of the contract, spread or stock on Date In. |
| Date Out | The date on which the trade was closedfor the given year. If the defined Date Out is a non-trading day then the trade is closed on the first trading date following the Exit Date. In a given year a trade may get stopped out. If so then Date Out is the date that the trade was stopped out. |
| Price Out | The closing price of the contract, spread or stock on Date Out. |
| Profit / Loss | For Long trades the Profit / Loss is the Price Out minus the Price In. For Short trades it is the opposite. |
| Total | The cumulative Profit / Loss over the history of the trade up until the given year. |
The bottom of each History page also displays two charts highlighting the historical performance of the trade.
The Annual Profit/Loss chart is a bar chart showing the profit or loss for each year of the trade:

The Cumulative Profit/Loss chart shows a trend chart of the cumulative profits over the history of the trade (i.e., a line chart of the Total column of the above History page).

Next Topic: Seasonal Charts